Guide on using RTL-SDR and URH to analyze and decode RF signals from a weather station
I bought a simple weather station, with temperature and humidity display for indoor and up to 3 wireless outdoor sensors (sold with only one though). Unfortunately, the one I got, had a non-functional outdoor sensor. I took it back to the store and got a replacement for the entire product. The outdoor sensor can be hanged on a wall with a small screw, but it can easily fall down.
Given the facts I initially got a broken sensor, the weather station can receive data from up to 3 sensors and because sensors are exposed to outdoor conditions, I decided to analyze the wireless protocol and maybe build my own device which will be able to emulate this kind of sensor. There is no information about wireless protocol of this weather station (sold by Lidl in Europe under the Auriol brand), except the frequency: 433.92 MHz. That was all I needed. And a software defined radio (I used RTL2832U dongle).
Decode with rtl_433
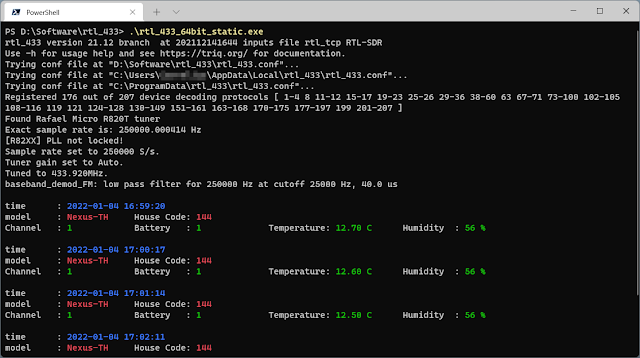
The first thing I like to do with unknown devices running in 433 MHz band is to use the powerful utility rtl_433. And it successfully decoded temperature and humidity for the device identified as "Nexus-TH".
 |
| Read sensor data using rtl_433 utility with RTL2832U dongle |
There is also a database of all known signals with links to rtl_433 source code where decoding takes place (select Decoders from top-left menu, search for nexus). It has very useful information, including modulation type, protocol timings and, very important, byte meaning of every data transfer (see below). This could be enough to encode this signal using an Arduino with a 433 MHz transmitter.
The sensor sends 36 bits 12 times, the packets are ppm modulated (distance coding) with a pulse of ~500 us followed by a short gap of ~1000 us for a 0 bit or a long ~2000 us gap for a 1 bit, the sync gap is ~4000 us.
The data is grouped in 9 nibbles:
[id0] [id1] [flags] [temp0] [temp1] [temp2] [const] [humi0] [humi1]
- The 8-bit id changes when the battery is changed in the sensor.
- flags are 4 bits B 0 C C, where B is the battery status: 1=OK, 0=LOW
- and CC is the channel: 0=CH1, 1=CH2, 2=CH3
- temp is 12 bit signed scaled by 10
- const is always 1111 (0x0F)
- humidity is 8 bits
But a good look at the analog signal is always useful since every implementation of the protocol may be slightly different (I am about to find that my sensor sends 36 bits 10 times only).
Capture transmission
Using Universal Radio Hacker (URH) we can record, analyze, tweak and re-transmit (if the hardware has transmit function) any signal. So, I recorded broadcasts on this frequency. The workflow is easy:
- Launch the software and go to Spectrum Analyzer (in File menu). Choose SDR device, set receiving frequency and gain, then wait for a signal. Increase gain if you don’t see anything for a while (and obviously make sure you are in the range of the device you are monitoring, and this device is actually transmitting RF). Note that RTL-SDR devices real gain is divided by 10 in URH (I set 80 for 8 dB). Spectrum Analyzer visually confirms the presence of a signal and its real frequency. Remember these parameters (frequency and gain). Use the spectrogram to find the real frequency of the signal (sometimes the waterfall display is shifted when a right scrollbar appears).
 |
| Identify signal on spectrogram |
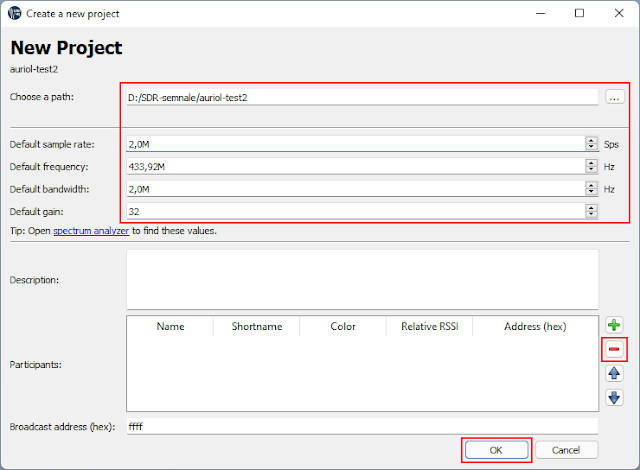
- Create a new project. Choose a folder where it will keep recording of received signals and project info. Set frequency according to spectrum analyzer. You can decrease bandwidth and sample rate to 1M since this signal is narrowband. Keep only one participant (this is one-way communication where only the outdoor unit transmits) - you can also remove both participants if you wish.
 |
| Create new project in URH |
- Record signal using the function in File menu. Set frequency with a slight offset of 20...100 kHz to what you received in the Spectrum Analyzer (since my signal was on 433.891 MHz, I can use 433.92 as receiving frequency). When doing this it is important to record for enough time to “catch” at least two bursts. Save recordings you like, clear when you do not receive anything. Close this window after you saved the signal. It is recommended to get the sensor next to the receiving antenna of the SDR. Look at the following recording with SDR gain 0 and sensor 50 cm near the antenna.
 |
| Record signal (two bursts) |
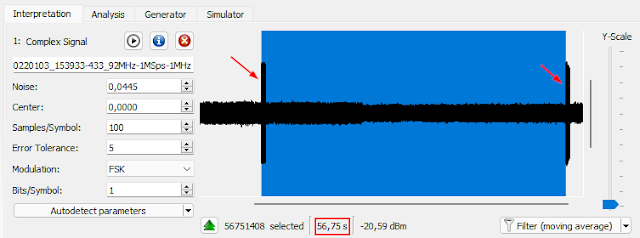
The amplitude of the signal should be at least double the noise amplitude. Drag the recording from the left pane into the Interpretation tab. The first thing I like to do is measure time between two successive transmissions. Or how often the sensor sends data.
 |
| Measure time interval between two transmissions |
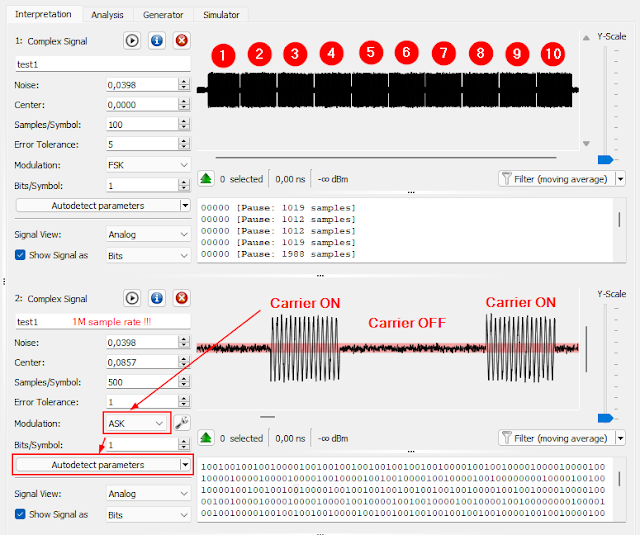
I found out the sensor sends data every 56.75 seconds (strange value, but this is it). Then I select only one transmission (with a little space before and after) to make a new signal from it (right click selection and choose Create signal from selection). It is much easier to scroll through a smaller sample. One of the first thing which points to my attention is the existence of 10 "blocks" (remember "the sensor sends 36 bits 12 times" - well, this one sends those bits 10 times).
Basic demodulation
But now it is time to look at a zoomed section and identify the modulation.
 |
| Identify modulation scheme and autodetect its parameters |
A basic carrier on and off is a digital form of amplitude modulation (AM). It is known as amplitude shift keying (ASK) when the carrier can have at least one fixed amplitude values. Since in this case there is only one amplitude used (full TX power), this one is also called on-off keying (OOK). Select ASK and click Autodetect parameters.
Important note: The frequency of the displayed carrier in URH is not the real frequency of the signal. It is not important though for AM modulations. Neither for FM/PM demodulation. But if you want to emulate FSK transmission you need to know the correct frequency shift of the recorded signal. I said earlier you should record signal on a frequency slightly different than the actual signal. In my case, signal was received on 433.891 MHz and I recorded on 433.92 MHz. This means carrier frequency appears in URH as 433.92 - 433.891 = 29 kHz. URH mixes received signal with the frequency you set and the result is the difference between the two.
The carrier is on for approximately 500 µs (that is exactly 500 samples at 1M sample rate). Then it is off for either 1000 µs, 2000 µs, 4000 µs or until the next transmission. This is pulse distance modulation (PDM), where the carrier off timings represent bits (1 ms and 2 ms). There is high similarity between this encoding and IR remote NEC protocol (with different timings though).
From now on I will assume a short space (1 ms) is bit 0 and a long space (2 ms) is bit 1. This is not an always true assumption (the designer of this device may have encoded bits the other way). Back to our numbers: 500, 1000 and 2000 (these are the important ones). We must compute the highest common factor of these (which is 500). In case you are analyzing an unknown PDM signal, and you have measured some strange timings, round them until you get a common factor which is not lower than a quarter of the shortest timing (the carrier on time of my signal is actually 482 µs).
The highest common factor is the Samples/Symbol number required for correct demodulation. The symbol is the equivalent of the bit in modulation scheme. An actual bit of data is represented by a number of symbols. Looking at the above encoding, a carrier burst has 1 symbol, the following space for bit 0 has 2 symbols (1 ms) while the space for bit 1 has 4 symbols (2 ms). The 4 ms space (which is the pause between the 10 transmissions) has 8 symbols. For most PDM schemes, the carrier burst time is equivalent to 1 symbol, while following spaces are multiples of this. If your transmission has pauses, use the settings button next to modulation combo box and set correct Pause Threshold (I had to set it to 7 instead of 8 to get correct splitting of the transmission).
 |
| Split transmission after setting pause threshold |
Also make sure noise level is correctly set. The red band should cover the noise. You can make it thicker by increasing noise level.
Bits/Symbol parameter is one I cannot understand. It should have been symbols per bit. And cannot be used for PDM because of the different bit length:
- Bit 0: 1 symbol carrier + 2 symbols space; decoded as 100;
- Bit 1: 1 symbol carrier + 4 symbols space; decoded as 10000.
Unfortunately, URH does not allow setting different bit lengths for 0 and 1. So, for now we'll consider 1 symbol = 1 bit before moving to Analysis tab. Close any other opened signals in Interpretation tab.
Digital Analysis
In Analysis tab you should see a bit table with a number of rows equal to number of split transmissions (10 in my case). It is time to make or own modulation decoding scheme because URH does not decode PDM. Go to Edit - Decoding.
Similar to how an IR receiver works, we should invert the signal. This is because the number of zeros carries the actual information. After inverting, "011" is bit 0 and "01111" is bit 1 (refer to above bit definition). Then use Morse Code, because description says information is transported with "long and short sequences of 1 (0 just for padding)". Therefore, we have 2 of 1 for bit 0 and 4 of 1 for bit 1. And only 1 of 0 for padding. You can also live test this decoding with the recorded signal or anything you enter by keyboard. Referring to bit definition, 1001000010000100 should decode to 0110.
 |
| Create custom decoder in URH |
Save the new decoding scheme under the name PDM (or whatever you want). Then apply it to your signal. And you have a complete decoding. I selected bits then I created labels for specific groups according to the information I found in rtl_433 protocol database. If this wouldn't have been available, I would have to make multiple signal recordings at different values of temperature and humidity, then try to figure what bits change and how they represent actual data. This is a time-consuming process prone to failures because symbol-to-bit assignment as well as endianness can only be guessed. If they are guessed wrong, all one can do is change each one at a time and start over. Nevertheless, a 36-bit data transmission is not (usually) impossible to decode.
 |
| Decoded bitstreams |
The first and the last messages have missing bits. In the first transmission, the first 4 bits are omitted. Don't know why. After the 10th transmission, there is no pause burst, the decoder thinks transmission ends after the last burst and it cannot obtain a proper bitstream after inverting signal.
 |
| First and last data transmissions have missing bits |
Conclusion
With SDR hardware and a utility like URH you can analyze signals from various devices. Since the signal shown here is ASK modulated, I can reproduce it pretty easy with an Arduino and 433 MHz transmitter (FS1000A module). ASK is quite common and fortunately it is easy to generate. In the follow-up post I built a prototype unit using Arduino and DHT22 sensor. The signal can also be decoded with a 433.92 MHz receiver and Arduino or ESP8266 development board.
If you want to analyze one of the signals I recorded for this post, you can download the 1M sampled recording here. As an alternative to URH, you can use any SDR application (SDR#, SDRangel) to record the unknown signal after SSB demodulation. In this way you get, just like in URH, a carrier frequency in kHz range, which can be analyzed with Audacity.


is this the Oregon Scientific protocol for weather station sensors?
ReplyDeleteOregon Scientific protocol is OOK with Manchester coding, while this one is OOK with PDM (pulse distance modulation). This is therefore a different protocol.
DeleteHi Cornelius,
Deletecould you help me with code for Arduino to decode the sensor data. I have the same sensor as you but I would like to capture the sensor data with a 433mHz receiver and an Arduino Uno, write sensor data to serial.
The receiver I have:
433Mhz RF Transmitter and Receiver Module Kit xy-mk-5v for Arduino
Receiver module parameters
1.Product Model: MX-05V
2.Operating voltage: DC5V
3.Quiescent Current: 4MA
4.Receiving frequency: 433.92MHZ
5.Receiver sensitivity:-105DB
6.Size: 30 * 14 * 7mm
7.External antenna: 32CM single core wire, wound into a spiral
Hi. I have this project on my list for a while and I haven't got the time to do it.
DeleteThis is a good starting point: https://rayshobby.net/wordpress/reverse-engineer-wireless-temperature-humidity-rain-sensors-part-1/. The code needs to be adapted to this particular sensor.
Thank you for the reply,
Deletethat post was my starting point, but got a little over my head. This is my first project with 433 radio.
Tried the Arduino Program for Sniffing Bits but did not get anything. Found a library (https://www.arduino.cc/reference/en/libraries/rf433any/) and got this as a result:
15:22:23.616 -> rf.register_Receiver(
15:22:23.616 -> , // mod
15:22:23.616 -> 65535, // initseq
15:22:23.616 -> 0, // lo_prefix
15:22:23.616 -> 0, // hi_prefix
15:22:23.616 -> 0, // first_lo_ign
15:22:23.616 -> 480, // lo_short
15:22:23.616 -> 480, // lo_long
15:22:23.616 -> 1012, // hi_short (0 => take lo_short)
15:22:23.616 -> 1980, // hi_long (0 => take lo_long)
15:22:23.616 -> 0, // lo_last
15:22:23.616 -> 4000, // sep
15:22:23.616 -> 0 // nb_bits
15:22:23.616 -> );
I understand if you do not have time to take a look, but I think I'm on the right track just need to corelate the raw data to temp and hum data. In this case it was 22.2C / 58%
What is your progress with this, Zee? I managed to write a protocol decoder: https://gist.github.com/onetransistor/773ceee205a55e7e74146d75d93300b5.
DeletePlease note that I only tested this with the direct signal produced by a second Arduino which generates the bitstream. I cannot use the MX-05V module because it continuously outputs noise. I have to get some superheterodyne 433 MHz modules and try with those.
The post about protocol decoding with Arduino/ESP8266 is now published: Receive weather station data with Arduino
DeleteJust a little addon:
ReplyDeleteThat 0 bit between the battery and channel bits is:
- 0 in normal transmission (when the device periodically send the data by itself)
- 1 in forced transmission (when you press the Tx button on the back)
I waited for data to arrive in normal mode so I didn't notice that. Thank you for this information!
DeleteI came across the tx whilst using openwebrx and thanks to your article I know what it is and how to decode the data. Thank you for sharing your knowledge!
ReplyDelete